CenterPoint® Accounting
- Compare Department Balances using Financial Analysis
Related Help

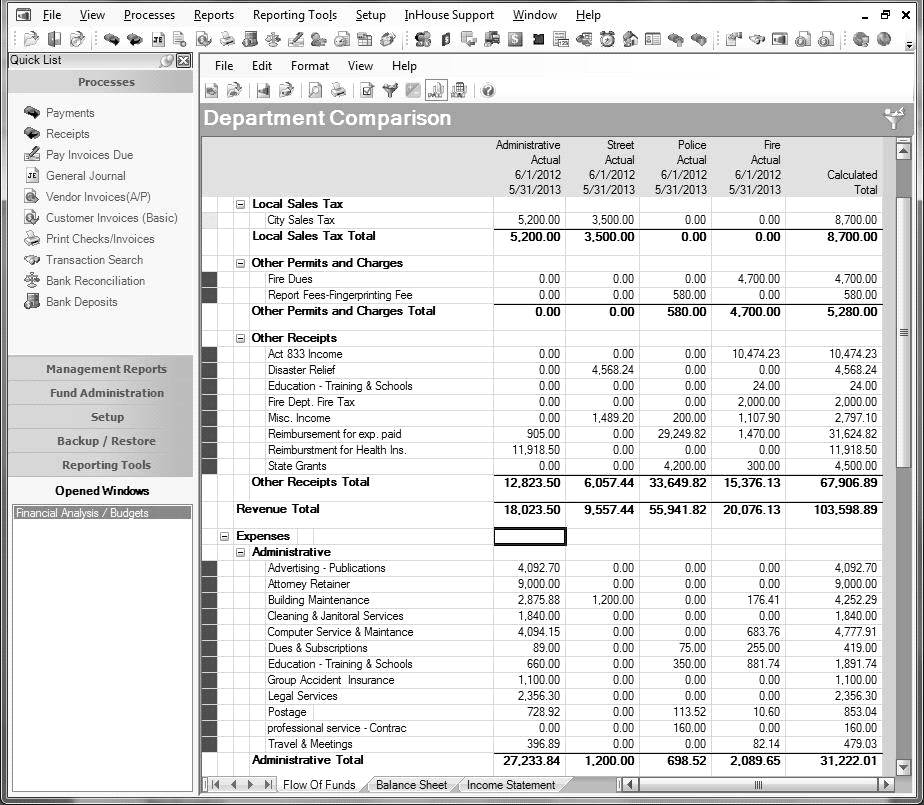
In this topic, we'll provide step-by-step instructions for creating a financial analysis that compares departments in side-by-side columns for one time period.
Note: Refer to the main Understanding and Using Financial Analysis topic for additional information on printing a financial analysis, editing actual data and common modifications to an analysis.
Create the Financial Analysis:
- Select Reporting Tools > Financial Analysis.
- Click New to create a new analysis.
Note: If you have an existing analysis that you'd like to use for this process, select it from the list instead of clicking New.
- Enter a Name that describes the analysis.
- Select the date range for this analysis in the From/To fields
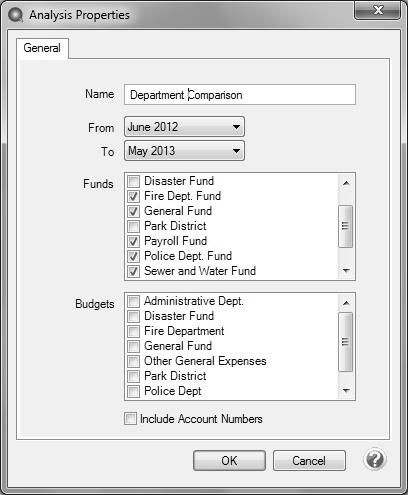
- Select the appropriate Funds for this analysis. One or more funds can be included in a single analysis.
- Click OK to display the financial analysis.
- By default the data will be displayed for each month specified. Select Format > Predefined Layouts > Annual to display the data in a year-to-date column instead.
- Click OK on the Formatting Options screen that automatically displays after selecting Annual.
- Select Format > Columns to begin adding columns for each department.
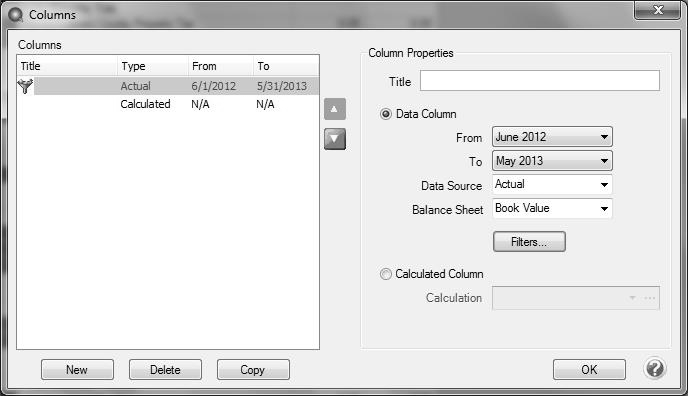
- Select the Actual row on the left and click the Filters button on the right.
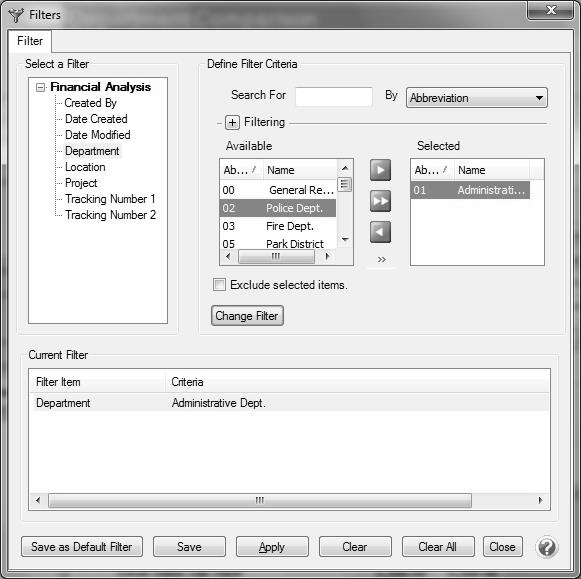
- In the Filters screen under Select a Filter > Financial Analysis, select Department. The departments will then be listed on the right.
- Use the green right arrow to move the department you wish to display in the first column of the analysis to the Selected side of the screen.
- Click Add Filter and then click Apply.
- Back on the Columns screen, enter a Title that describes this column such as Administrative.
- Next we will “Copy” the new Administrative column to make the next department column. Select the first column that was created (Administrative in the sample) and click Copy.
- Follow steps 7-10 again for this department.
- Continue using Copy to add a column for each department you want included in the analysis.
- Once all departments for this analysis have been added, you can use the green Up / Down arrows to order the columns.
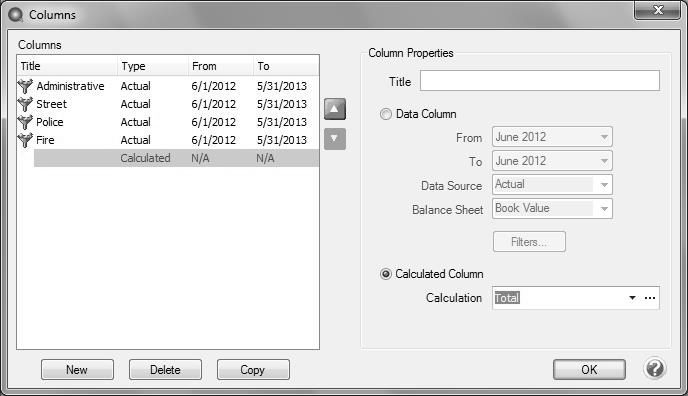
- The Calculated column can be set to add a total column to the analysis. Select the Calculated row from the left side of the screen and then click on the ...button to the right of the Calculation box.
- The Calculation screen will be displayed. Double-click on each column that should be included in the Total column. A green dot at the left indicates the column is included in the calculation. Click OK.
- Click OK and the financial analysis with modified columns will be displayed.
- Select Format > Save Current As to save the analysis columns for future use. Specify a Name and click OK.
|
Document: 3234 |
|---|