CenterPoint® Accounting
- Side-by-Side Twelve Month Comparison using Financial Analysis
Related Help

This topic provides step-by-step instructions for creating a 12 month side-by-side monthly comparison using Financial Analysis.
Create the Analysis
- Select Reporting Tools > Financial Analysis.
- In the Open Analysis screen, click New to create a new analysis.
- Enter a Name that describes the analysis, for example 2023 Analysis.
- Select the date range of January 2023 - December 2023 in the From/To fields.
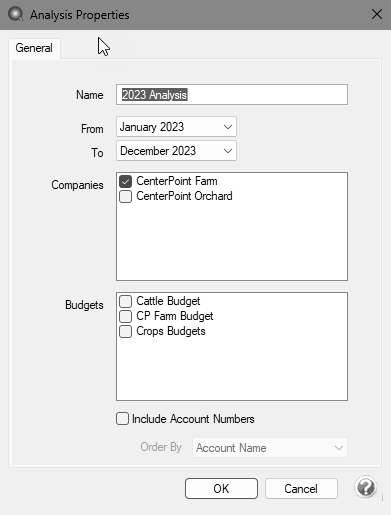
- Select the appropriate Companies for this analysis. One or more companies can be included in a single analysis.
- Select the Include Account Numbers check box if account numbers should be displayed for each account.
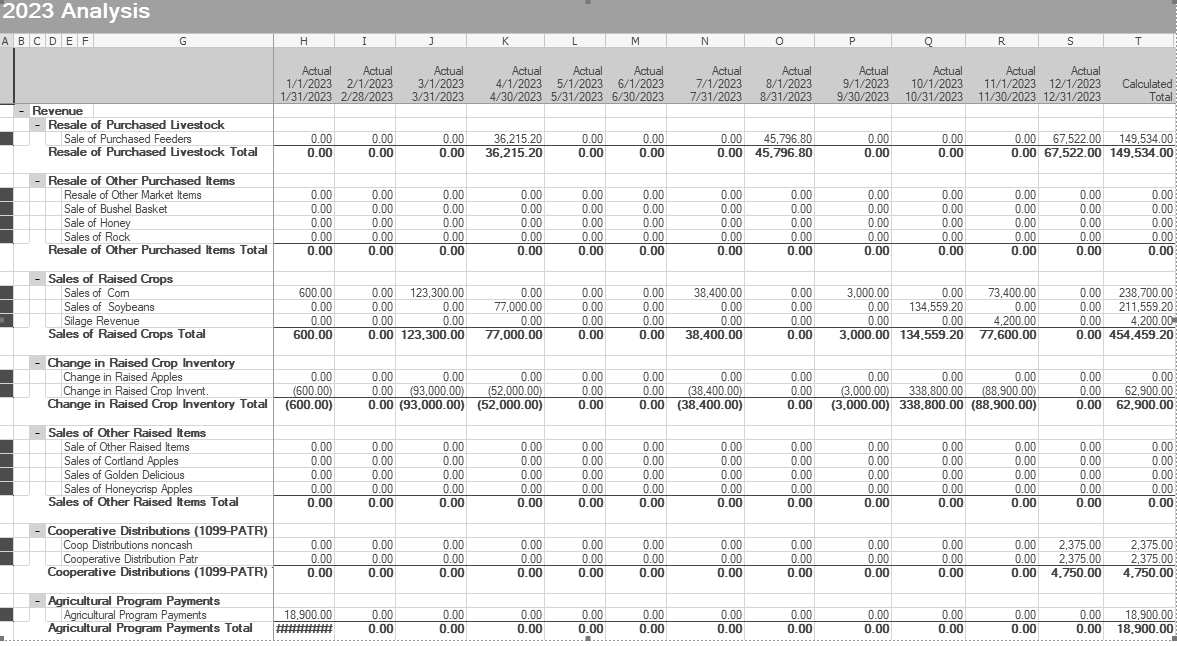
- Click OK to display a financial analysis with all twelve months side by side with a calculated total column at the end of the comparison.
Customize and Work with the Analysis
- Some common functionality can help you customize and work with the analysis:
- The data in a financial analysis is organized into three separate tabs:
- Flow of Funds - Reports the transaction activity to all accounts. Does not include beginning balances for Balance Sheet accounts.
- Balance Sheet - Represents the financial position of the company/fund at any point in time. The equation for the Balance Sheet is Assets = Liabilities + Owner's Equity. The Balance Sheet includes two account levels, Book Value (the calculated value affected by transaction activities) and Fair Market Value (the position of the company/fund if it were to sell today).
- Income Statement - An accrual report that represents the profit of the company/fund for the time span specified. Determining the profit of the company/fund needs to reflect all money earned by the company/fund. It measures the difference between operating income and operating expenses.
- The data in a financial analysis is organized into three separate tabs:
- The rows that have all zero dollar amounts in a financial analysis can be hidden by selecting View > Hide Zero Rows.
- By default the data will be displayed for each month specified. If you prefer to view quarterly or annual numbers instead, select Format > Predefined Layouts and choose the appropriate option (Monthly, Quarterly or Annual).
- The report can be exported to Excel by selecting File > Export.
Note: Refer to the main Understanding and Using Financial Analysis topic for additional information on customizing and other common modifications to an analysis.
|
Document: 3466 |
|---|